
ASSESSMENT OF SOIL FERTILITY STATUS IN MAYADEVI RURAL MUNICIPALITY, RUPANDEHI, NEPAL
Institute of Agriculture and Animal Science (IAAS), Paklihawa Campus, Tribhuvan University, Nepal.
Corresponding author: Janma Jaya Gairhe | Email: janmajaya@gmail.com
Abstract
Soil fertility assessment underpins evidence-based agricultural planning at the local level, yet ward-wise fertility data remain scarce for many rural municipalities of Nepal. This study evaluated the soil fertility status of Mayadevi Rural Municipality, Rupandehi district, Nepal, based on 57 surface soil samples (0-20 cm depth) collected from wards 3, 4, 5 and 6 and analyzed for pH, electrical conductivity (EC), organic matter (OM), total nitrogen (N), available phosphorus (P2O5) and available potassium (K2O). Soil pH ranged from 5.2 to 7.2 (mean 6.21), and 64.9% of samples were moderately acidic. Organic matter was predominantly medium in status (mean 2.43%), while total nitrogen was highly variable (mean 0.22%, CV 137.8%) with about 47% of samples rated low. Available phosphorus was uniformly low across all four wards (mean 10.74 kg P2O5/ha, range 1.29-19.98), and available potassium ranged from low to medium (mean 96.58 kg K2O/ha). Electrical conductivity values (mean 0.21 dS/m) indicated no salinity constraint. These results show that nitrogen and, more critically, phosphorus are the primary yield-limiting nutrients across Mayadevi Rural Municipality, and that balanced fertilizer recommendation, organic matter management, and targeted liming in the more acidic wards are needed to sustain crop productivity.
Keywords: Fertilizer recommendation; Nutrient status; Phosphorus deficiency; Soil acidity; Ward-wise variation
How to Cite: Gairhe, J. J., Bhusal, A., & Pandey, B. (2026). Assessment of soil fertility status in Mayadevi Rural Municipality, Rupandehi, Nepal. Scientara Journal, 4(2), 1–9.
1. INTRODUCTION
Background
Soil is the fundamental natural resource on which agricultural production depends, and knowledge of its fertility status is essential for designing site-specific nutrient management strategies (Brady & Weil, 2002). In Nepal, where most rural households depend directly on agriculture for their livelihood, continuous cultivation, imbalanced fertilizer use, and inadequate incorporation of organic matter have contributed to widespread deficiencies of major nutrients in cultivated soils (Khadka et al., 2018; Karki et al., 2021). Nitrogen is the nutrient most frequently limiting to crop growth (Havlin et al., 2010), and household-level nitrogen balance studies in the mid-hills of Nepal have similarly reported negative or marginal balances under prevailing management practices (Pilbeam et al., 2000). Phosphorus, meanwhile, is often termed the master key nutrient because its deficiency restricts both root development and overall plant growth even when other nutrients are adequate (Foth & Ellis, 1997), and long-term rice-wheat trials in Nepal have documented declining soil fertility and yield trends where phosphorus and organic inputs are not adequately replenished (Regmi et al., 2002).
Statement of the problem
In the absence of systematic, ward-level soil fertility data, farmers and local agricultural planners in Nepal's rural municipalities lack the evidence needed to target fertilizer subsidy, soil amendments, and extension programs to the wards and nutrients where they are most needed. Mayadevi Rural Municipality, Rupandehi district, is one such area where such decisions have so far had to be made without a documented, ward-wise picture of soil nutrient status.
Review of previous works and research gap
Studies conducted elsewhere in Rupandehi district have reported that total nitrogen, potassium and organic matter status of farm soils are commonly low, even where available phosphorus is comparatively higher, and that soil pH in the district ranges from very strongly acidic to slightly alkaline (Gnyawali et al., 2020). Similar variability in nutrient status, driven by heterogeneous fertilizer application and management practices among smallholder farmers, has also been reported for other Terai municipalities of Nepal (Majengo et al., 2023).
Despite this documented variability at the district and regional level, no systematic ward-wise soil fertility assessment has previously been carried out for Mayadevi Rural Municipality itself, leaving a clear gap in the site-specific evidence base needed for local fertilizer recommendation.
Rationale of the study
Beyond its immediate relevance to fertilizer recommendation, the fertility baseline generated by this study may also inform prospects for crop diversification in the municipality. Rupandehi lies within the same western Terai belt as neighbouring Kapilvastu district, part of the traditional growing tract of Kalanamak (Kala Namak), a Geographical Indication-protected, black-husked aromatic rice landrace valued for its distinctive fragrance and market premium. Kalanamak is agronomically suited to low-input conditions: it is traditionally grown under rainfed management, tolerates a wide pH range including mildly acidic and saline-alkaline soils, and performs well with comparatively little fertilizer input, unlike high-yielding modern rice varieties that demand higher soil fertility. Given that the sampled soils of Mayadevi Rural Municipality were only moderately acidic, free of salinity constraints, and medium in organic matter, despite being low in phosphorus and variable in nitrogen, the fertility profile identified here does not preclude, and may in fact be well suited to, cultivation of such a hardy, low-input landrace. This raises the possibility of promoting Kalanamak as an alternative or supplementary crop in the more nutrient-poor wards, offering farmers a value-added, low-fertilizer-demand option alongside the standard nutrient management measures recommended below. Confirmatory agronomic trials would, however, be needed before recommending large-scale adoption.
Objectives
The present study was therefore carried out with the objective of assessing the soil pH, electrical conductivity, organic matter, total nitrogen, available phosphorus and available potassium status of farm soils across four wards of Mayadevi Rural Municipality, and of identifying the nutrients that limit soil fertility in the municipality.
2. MATERIALS AND METHODS
Study area
The study was carried out in Mayadevi Rural Municipality, Rupandehi district, Lumbini Province, in the western Terai region of Nepal. Soil samples were collected from farmers' fields in wards 3, 4, 5 and 6 of the municipality, representing the area covered under the municipality's soil testing program.
Soil sampling
A total of 57 surface soil samples were collected from individual farmers' fields across the four sampled wards at a depth of 0-20 cm using a standard soil sampling auger, following a composite sampling approach in which several sub-samples from within a field were pooled to obtain one representative sample per farmer, consistent with standard soil-testing protocol used in comparable studies (Khadka et al., 2018). Farmer name and ward number were recorded for each sample; precise GPS coordinates of the sampling points were not available, and ward number was therefore used as the spatial unit of analysis.
Laboratory analysis
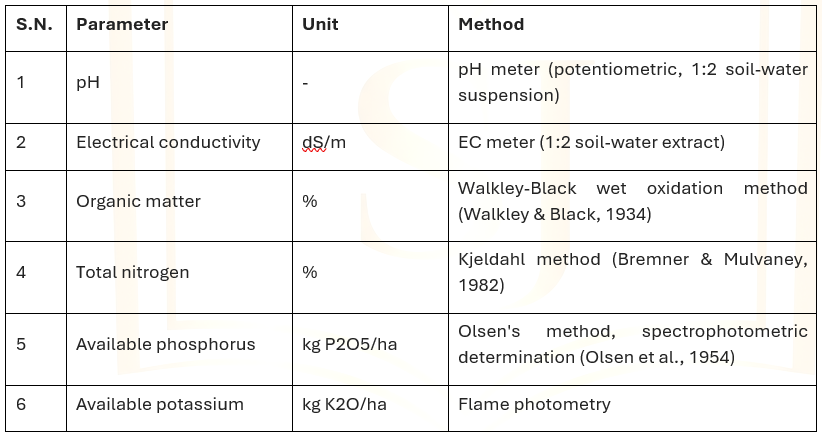
The collected soil samples were analyzed for pH, electrical conductivity (EC), organic matter (OM), total nitrogen (N), available phosphorus (P2O5) and available potassium (K2O) following standard analytical procedures (Table 1). Soil pH and EC were measured using a pH meter and an EC meter, respectively, on a 1:2 soil-water suspension/extract. Total nitrogen was determined by the Kjeldahl method, available phosphorus by Olsen's method using a spectrophotometer, and available potassium by flame photometry, consistent with the methodology followed in comparable NARC soil fertility assessments (Khadka et al., 2018).
Table 1. Soil parameters and analytical methods used for laboratory analysis
Statistical analysis and soil fertility rating
Descriptive statistics (mean, standard deviation, standard error, minimum, maximum and coefficient of variation) were computed for each parameter overall and by ward. Coefficient of variation (CV) was interpreted following Aweto (1982), where CV ≤ 25% indicates low variation, 25-50% moderate variation, and >50% high variation. Soil fertility ratings (low, medium, high, very high) were assigned following the standard classification used for Nepalese soils (Land Resource Mapping Project [LRMP], 1986), as adopted in comparable NARC soil fertility studies (Khadka et al., 2018): total N (%), <0.1 low, 0.1-0.2 medium, 0.21-0.4 high, >0.4 very high; available P2O5 (kg/ha), <30 low, 30-55 medium, 56-110 high, >110 very high; available K2O (kg/ha), <110 low, 110-280 medium, 281-450 high, >450 very high; and soil pH, <4.5 very strongly acidic, 4.5-5.5 strongly acidic, 5.5-6.5 moderately acidic, 6.5-7.3 neutral, 7.3-8.5 slightly alkaline, >8.5 strongly alkaline. Organic matter rating (low/medium/high) reported in the original soil test records was used directly and was not independently recalculated. In addition, a nutrient index (NI) was calculated for total N, available P2O5, available K2O and OM following the formula of Ramamurthy and Bajaj (1969):
NI = (NL × 1 + NM × 2 + NH × 3) / NT
where NL, NM and NH are the number of samples in the low, medium and high classes, respectively, and NT is the total number of samples. The resulting index was interpreted as low (NI < 1.67), medium (1.67-2.33) or high (NI > 2.33), following the same source.
3. RESULTS AND DISCUSSION
Table 2. Descriptive statistics of soil fertility parameters of Mayadevi Rural Municipality (n=57)
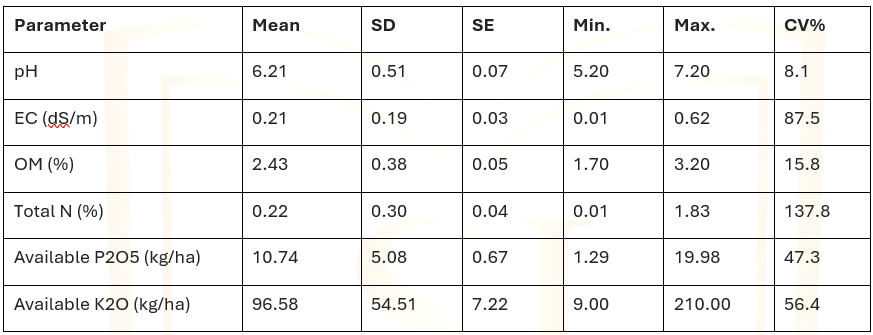
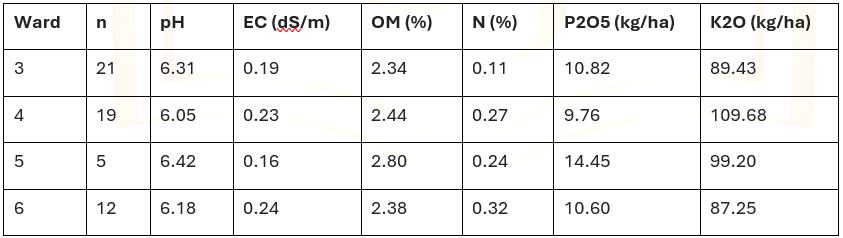
Table 3. Ward-wise mean values of soil fertility parameters of Mayadevi Rural Municipality
Soil reaction (pH)
Soil pH ranged from 5.2 to 7.2, with a mean of 6.21 (Table 2), indicating low variability (CV = 8.1%) among the sampled soils. The majority of samples (64.9%) were moderately acidic (pH 5.5-6.5), 31.6% were neutral, and only 3.5% were strongly acidic (Figure 1). Ward 5 recorded the highest mean pH (6.42) and ward 4 the lowest (6.05) (Table 3), though the range across wards was narrow. The predominance of moderately acidic soils is consistent with reports from Sainamaina Municipality in the same district, where soil pH was found to range from very strongly acidic to slightly alkaline (Gnyawali et al., 2020). Since the optimum pH range for nutrient availability to most crops is between 6.0 and 7.5 (Sanchez et al., 2003, as cited in Khadka et al., 2018), the majority of soils in Mayadevi Rural Municipality fall within or close to this favourable range, though the moderately acidic soils, particularly in ward 4, would benefit from periodic liming to improve nutrient availability and microbial activity.
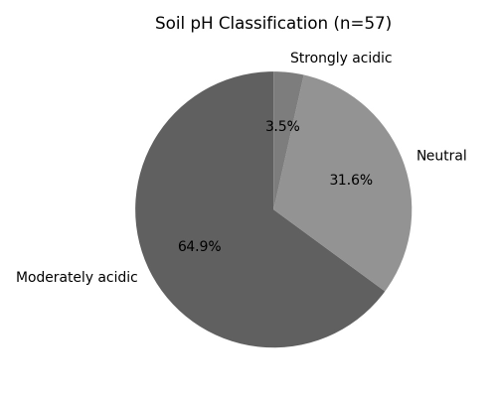
Figure 1. Soil pH classification of Mayadevi Rural Municipality (n=57)
Organic matter
Organic matter content ranged from 1.70% to 3.20%, with a mean of 2.43% and low variability (CV = 15.8%) (Table 2). Based on the ratings reported in the original soil test records, the majority of samples (46 of 57, 80.7%) fell in the medium category, 9 samples (15.8%) were low, and 2 samples (3.5%) were high. Ward 5 recorded the highest mean OM (2.80%), while ward 3 recorded the lowest (2.34%) (Table 3). Adequate organic matter is central to soil physical, chemical and biological properties, acting as a reservoir of nutrients and improving cation exchange capacity (Havlin et al., 2010). The predominantly medium status observed here is comparatively more favourable than reports of low organic matter status from some other Terai research farms (Khadka et al., 2018), and likely reflects the regular incorporation of farmyard manure typical of smallholder farming systems in the area. Continued and, where possible, increased use of farmyard manure, compost and green manure is recommended to sustain and further improve organic matter status, particularly in ward 3.
Total nitrogen
Total nitrogen content ranged from 0.01% to 1.83%, with a mean of 0.22% and very high variability (CV = 137.8%) (Table 2). Using the standard rating scale, 27 samples (47.4%) were low, 16 (28.1%) medium, 6 (10.5%) high and 8 (14.0%) very high in nitrogen status (Figure 2). Ward 6 recorded the highest mean N (0.32%) and ward 3 the lowest (0.11%) (Table 3). The extremely high CV for nitrogen, well above the high-variability threshold of 50% (Aweto, 1982), reflects a small number of samples with markedly higher nitrogen content than the rest of the dataset, likely arising from localized differences among individual farmers' fields in recent manure application, crop residue incorporation, or fallow history, in contrast to the low-to-moderate total N variability more commonly reported elsewhere (Khadka et al., 2018). Overall, the high proportion of low-to-medium nitrogen samples (75.5% combined) is consistent with reports of widespread nitrogen deficiency in cultivated soils of Rupandehi district (Gnyawali et al., 2020) and reflects the generally high crop demand for nitrogen relative to its natural replenishment through organic matter mineralization (Havlin et al., 2010). Balanced and split application of nitrogenous fertilizer, timed to crop demand, is recommended across the municipality, with particular attention to ward 3.
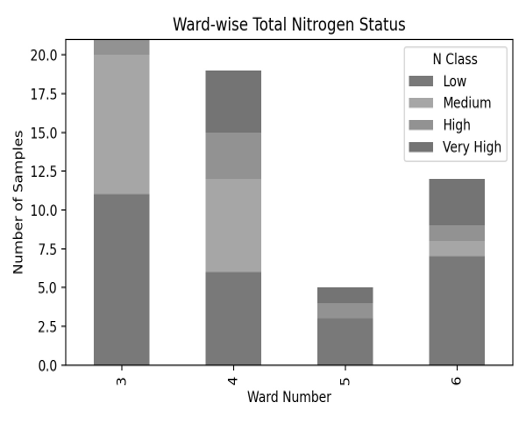
Figure 2. Ward-wise total nitrogen status of Mayadevi Rural Municipality
Available phosphorus
Available phosphorus (P2O5) ranged from 1.29 to 19.98 kg/ha, with a mean of 10.74 kg/ha and moderate variability (CV = 47.3%) (Table 2).
All 57 samples (100%) fell in the low category under the standard rating scale (Figure 3), with ward 5 recording the highest mean (14.45 kg/ha) and ward 4 the lowest (9.76 kg/ha) (Table 3). This uniformly low phosphorus status across all four wards contrasts with the comparatively higher phosphorus levels reported for nearby Sainamaina Municipality in the same district (Gnyawali et al., 2020), and indicates that phosphorus, more than any other nutrient measured, is the primary factor limiting soil fertility in Mayadevi Rural Municipality. A similar pattern of phosphorus deficit linked to under-replenishment relative to crop demand has been reported for maize-wheat systems elsewhere in Nepal, where farmers who rely mainly on farmyard manure rather than phosphatic fertilizer sustain a persistent negative phosphorus balance (Rawal et al., 2022). Because phosphorus availability strongly influences root development and early plant vigour (Foth & Ellis, 1997), and because none of the sampled wards showed even medium status, full recommended doses of phosphatic fertilizer (e.g., DAP) are advised for all four wards, alongside soil testing on a wider sample of farms to confirm the extent of the deficiency.

Figure 3. Ward-wise available phosphorus (P2O5) status of Mayadevi Rural Municipality
Available potassium
Available potassium (K2O) ranged from 9.00 to 210.00 kg/ha, with a mean of 96.58 kg/ha and high variability (CV = 56.4%) (Table 2). Of the 57 samples, 36 (63.2%) were low and 21 (36.8%) were medium in potassium status (Figure 4); none reached the high category. Ward 4 recorded the highest mean K2O (109.68 kg/ha), the only ward with a mean in the medium range, while ward 6 recorded the lowest (87.25 kg/ha) (Table 3). Potassium plays an important role in water regulation and enzyme activation in plants (Havlin et al., 2010), and the predominance of low-to-medium status observed here is consistent with widespread potassium deficiency reported for smallholder-managed soils elsewhere in the western Terai (Majengo et al., 2023). Continued application of potash fertilizer (e.g., MOP) at recommended doses is advised, particularly in wards 3 and 6.

Figure 4. Ward-wise available potassium (K2O) status of Mayadevi Rural Municipality
Electrical conductivity
Electrical conductivity ranged from 0.01 to 0.62 dS/m, with a mean of 0.21 dS/m and high variability (CV = 87.5%) (Table 2). All recorded values were well below the threshold of 4 dS/m generally used to indicate saline soil conditions (Havlin et al., 2010), confirming that soil salinity is not a constraint to crop production in the sampled wards of Mayadevi Rural Municipality at present.
Ward-wise variation
Comparison across wards (Table 3) shows that ward 5, despite having the smallest sample size (n=5), consistently recorded the most favourable fertility indicators, including the highest mean pH, organic matter and phosphorus. Ward 3 recorded the lowest mean nitrogen and organic matter, while ward 6 recorded the highest mean nitrogen but the lowest mean potassium. These differences likely reflect variation in cropping pattern, manure application and fertilizer use practices among farmers across wards rather than any inherent difference in parent soil material, and suggest that fertilizer recommendations for the municipality should be differentiated by ward rather than applied uniformly.
Nutrient index
Table 4. Nutrient index of soil fertility parameters of Mayadevi Rural Municipality
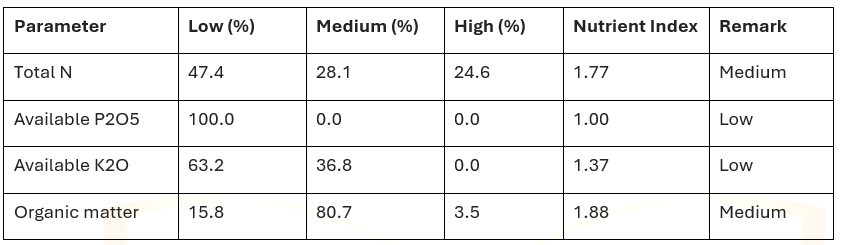
The nutrient index confirms the pattern seen in the individual ratings: available phosphorus has the lowest index of all four parameters (NI = 1.00, low), followed by available potassium (NI = 1.37, low), while total nitrogen (NI = 1.77) and organic matter (NI = 1.88) fall in the medium category. This ordering reinforces phosphorus as the single most limiting nutrient for crop production across Mayadevi Rural Municipality, consistent with the nutrient-index-based prioritization approach used in other NARC soil fertility assessments (Khadka et al., 2018).
4. CONCLUSION
The soils of Mayadevi Rural Municipality are predominantly moderately acidic to neutral in reaction, medium in organic matter, variable but frequently deficient in nitrogen, uniformly low in available phosphorus, and low to medium in available potassium, with no evidence of salinity constraint. Phosphorus emerges as the most critical limiting nutrient across all four sampled wards, followed by nitrogen and potassium. Balanced fertilizer recommendations prioritizing phosphatic fertilizer, together with continued organic matter management through farmyard manure and compost, and targeted liming in the more acidic pockets of ward 4, are recommended to sustain and improve crop productivity in the municipality. These findings can serve as a baseline for the municipality's agriculture section in planning fertilizer subsidy and extension programs, and future studies covering all wards of the municipality with georeferenced sampling are recommended to develop a complete soil fertility map.
Acknowledgement
The authors thank the farmers of wards 3, 4, 5 and 6 of Mayadevi Rural Municipality for allowing soil sample collection from their fields. This study was supported by Mayadevi Rural Municipality, which funded the soil testing program under which the samples were collected, and by the Institute of Agriculture and Animal Science (IAAS), Paklihawa Campus, which provided laboratory and technical support for soil analysis.
REFERENCES
- Aweto, A. O. (1982). Variability of upper slope soils developed under sandstones in South-western Nigeria. Geographical Journal, 25, 27-37.
- Bremner, J. M., & Mulvaney, C. S. (1982). Nitrogen—total. In A. L. Page (Ed.), Methods of soil analysis, Part 2: Chemical and microbiological properties (2nd ed., pp. 595-624). American Society of Agronomy.
- Brady, N. C., & Weil, R. R. (2002). The nature and properties of soils (13th ed.). Pearson Prentice Hall.
- Foth, H. D., & Ellis, B. G. (1997). Soil fertility (2nd ed.). Lewis/CRC Press.
- Ghimire, P., Shrestha, S., Acharya, A., Wagle, A., Acharya, T. D., & Mondal, S. (2024). Soil fertility mapping of a cultivated area in Resunga Municipality, Gulmi, Nepal. PLOS ONE, 19(1), e0292181. https://doi.org/10.1371/journal.pone.0292181
- Gnyawali, B., Mandal, U. K., & Aryal, I. (2020). Soil fertility assessment of Sainamaina Municipality, Rupandehi, Nepal. The Geographical Base. [Volume/issue to be verified before submission.]
- Havlin, J. L., Beaton, J. D., Tisdale, S. L., & Nelson, W. L. (2010). Soil fertility and fertilizers: An introduction to nutrient management (7th ed.). PHI Learning.
- Karki, K. B., Sherchan, D. P., Panday, D., & Ghimire, R. (2021). Soil fertility and nutrient management. In K. B. Karki, D. P. Sherchan, D. Panday, & R. Ghimire (Eds.), The soils of Nepal (pp. 111-126). Springer. https://doi.org/10.1007/978-3-030-80999-7_9
- Khadka, D., Lamichhane, S., Bhurer, K. P., Chaudhary, J. N., Ali, M. F., & Lakhe, L. (2018). Soil fertility assessment and mapping of Regional Agricultural Research Station, Parwanipur, Bara, Nepal. Journal of Nepal Agricultural Research Council, 4(1), 33-47. https://doi.org/10.3126/jnarc.v4i1.19688
- Khadka, D., Lamichhane, S., Shrestha, K., Joshi, S., Karna, M., Pant, B. B., & Yadav, S. (2017). Soil fertility assessment and mapping of Agricultural Research Station, Jaubari, Illam, Nepal. International Journal of Environment, 6(3), 46-70. https://doi.org/10.3126/ije.v6i3.18097
- Khadka, D., Lamichhane, S., Amgain, R., Joshi, S., Vista, S. P., Sah, K., & Ghimire, N. H. (2019). Soil fertility assessment and mapping spatial distribution of Agricultural Research Station, Bijayanagar, Jumla, Nepal. Eurasian Journal of Soil Science, 8(3), 237-248. https://doi.org/10.18393/ejss.566551
- Land Resource Mapping Project [LRMP]. (1986). Land system report: The soil landscape of Nepal. Government of Nepal, Kenting Earth Sciences. [To be verified before submission.]
- Majengo, C. O., Mutonyi, J., & Agamala, C. (2023). Assessment of soil fertility status in Rupani Rural Municipality, Saptari, Nepal. AgroEnvironmental Sustainability. [Volume/issue/DOI to be verified before submission.]
- Olsen, S. R., Cole, C. V., Watanabe, F. S., & Dean, L. A. (1954). Estimation of available phosphorus in soils by extraction with sodium bicarbonate (USDA Circular No. 939). United States Department of Agriculture.
- Pilbeam, C. J., Tripathi, B. P., Sherchan, D. P., Gregory, P. J., & Gaunt, J. (2000). Nitrogen balances for households in the mid-hills of Nepal. Agriculture, Ecosystems & Environment, 79(1), 61-72. https://doi.org/10.1016/S0167-8809(99)00143-7
- Ramamurthy, B., & Bajaj, J. C. (1969). Available nitrogen, phosphorus and potassium status of Indian soils. Fertiliser News, 14, 25-36.
- Rawal, N., Pande, K. R., Shrestha, R., & Vista, S. P. (2022). Soil nutrient balance and soil fertility status under the influence of fertilization in maize-wheat cropping system in Nepal. Applied and Environmental Soil Science, 2022, Article 2607468. https://doi.org/10.1155/2022/2607468
- Regmi, A. P., Ladha, J. K., Pathak, H., Pasuquin, E., Bueno, C., Dawe, D., & Pandey, S. P. (2002). Yield and soil fertility trends in a 20-year rice-rice-wheat experiment in Nepal. Soil Science Society of America Journal, 66(3), 857-867. https://doi.org/10.2136/sssaj2002.8570
- Walkley, A., & Black, I. A. (1934). An examination of the Degtjareff method for determining soil organic matter, and a proposed modification of the chromic acid titration method. Soil Science, 37(1), 29-38.